Power BI is Microsoft’s new data visualization platform. It allows you to easily pull data from datasources like Salesforce, GitHub and QuickBooks. As I was going through the product I noticed they didn’t have a StackOverflow service connection, so I built one. StackOverflow has a REST/JSON API, but Power BI doesn’t allow you to connect directly to an API yet. Instead of hitting the API directly, I wrote an Azure Web Job to pull the data from the StackOverflow API into an Azure SQL Database and then built the Power BI dashboard from that.
A StackOverflow dashboard is useful for teams who want to monitor and improve their community engagement. The dashboard will be a quick and easy way for teams to see how many questions are unanswered, how many have no responses, how long it takes to get a response, number of question views over time and number of questions created over time. There’s a lot more insights you could pull from the StackOverflow data, but for now we’ll start with these metrics:
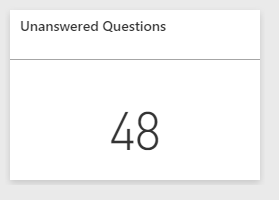
1. Number of Unanswered Questions – These questions may have responses, but none of them are marked as “Answered”.
2. Number of Responseless Questions – These questions have no responses at all.
3. Time to First Response – The time difference between the creation of the question and the first response.
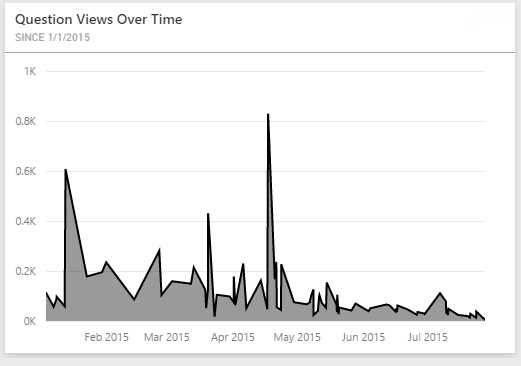
4. Number of Question Views Over Time – The number of views per month.
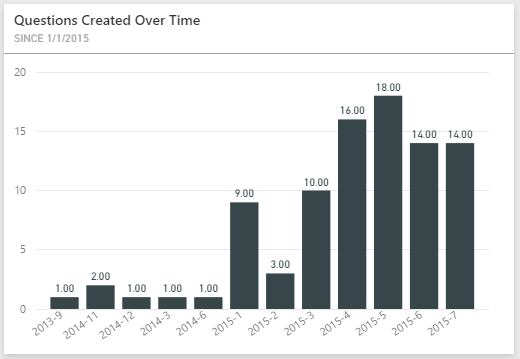
5. Number of Questions Created Over Time – The number of questions created per month.
[
Here’s a list of the components you’ll need to build this out yourself.
1. StackOverflow API – The StackOverflow endpoint that allows you to programmatically access question data.
2. Azure SQL Database – Where you will store the StackOverflow questions relevant to your Power BI Dashboard.
3. Azure WebJob (Node.js or C#) – The “console app in the cloud” that will pull data from the StackOverflow API and push it to an Azure SQL Database
4. Power BI – You will use DataSets and Reports to create your Dashboard.
All of the code for this post can be found on GitHub here: https://github.com/jongio/PowerBI-StackOverflow
StackOverflow API
StackOverflow has a robust API at http://api.stackexchange.com. You’ll want to use V2.2.
Here’s an example URL:
https://api.stackexchange.com/2.2/questions?order=desc&sort=creation&tagged=powerbi&site=stackoverflow. That returns a JSON that looks like this:
Use a filter
The query above will return questions that are tagged with ‘powerbi’ – but it doesn’t contain the ‘answer’ data, which you will need for your Power BI Dashboard. StackOverflow allows you to create ‘filters’ to add that additional data. You can use the one I created** ‘!9YdnSIN1B’** or create your own here: http://api.stackexchange.com/docs/create-filter
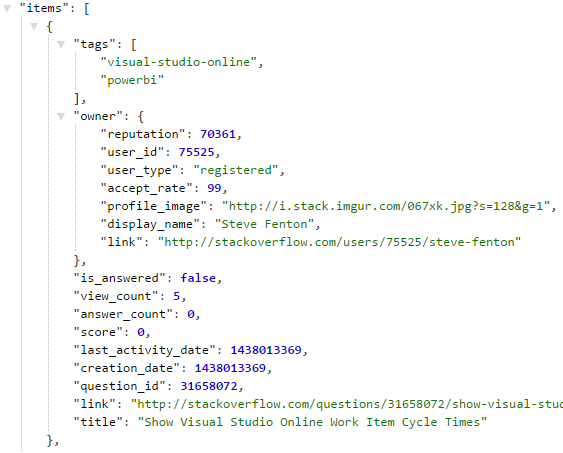
Here’s the same URL as above, but with the filter applied:
You’ll notice that it now has answer data:
[
Register your app
By default, StackOverflow will limit your requests to 300 a day, but will up that to 10k a day if you register your application and send a key with each request.
Register your application to get a key http://stackapps.com/apps/oauth/register. Save your key, you will need it when you setup your Azure WebJob.
Here’s the same URL as above, but with the key applied:
(It’s not hyperlinked, because I don’t want my apps key to be on the internet in plain text)
Azure SQL Database
As mentioned above, Power BI cannot talk directly to the StackOverflow API, so we need to cache the data in an Azure SQL Database. (You, of course, can use any database you’d like, but I prefer to use Azure SQL Database). Just create a new database and execute the following scripts to create one table, one proc and two views.
Azure Node.js WebJob
An Azure WebJob is like a console app running on a scheduled task in the cloud. You can write them in C# or Node.js. I’ll use Node.js for this example. You can find the WebJob code on GitHub here.
The WebJob process flow is simple; it will request the question data via the StackOverflow API and insert it into the database.
Create the WebJob
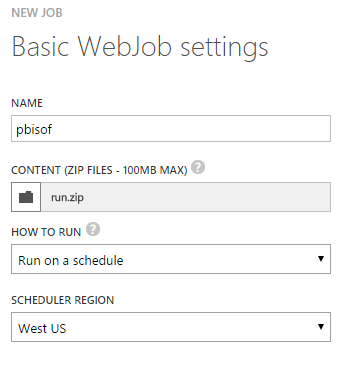
WebJobs are housed within Webapps, so just create a Webapp and click on the WebJob tab:

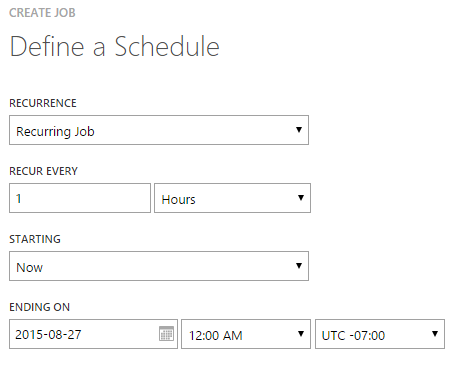
Create a new WebJob and upload this zip file. I set mine to run once an hour – feel free to configure your schedule as you wish.
You can also fork the PowerBI-StackOverflow repo and update the code as you wish. I’ve found that using an FTP client to upload WebJob is much easier than using the Azure web interface. If you use FTP, then just upload the code to this folder: /site/wwwroot/App_Data/jobs/triggered/pbisof
Config
The WebJob uses appSettings from the Webapp. Documentation for all of the variables can be found in the header of the run.js file.
You can configure them using the Web app Config tab in Azure:
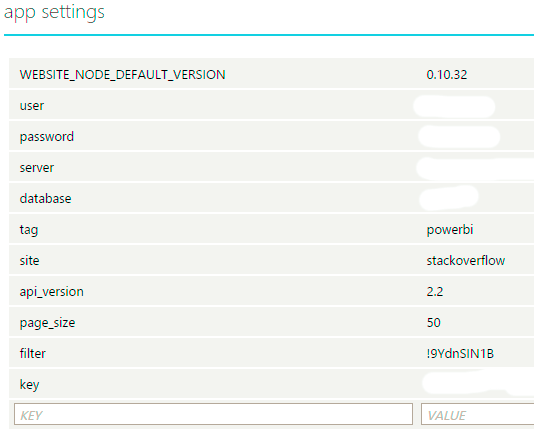
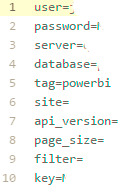
When you run the Node.js script locally you will want to create an .env file in the WebJob folder that looks like this and enter the values applicable to your database and your StackOverflow key.
Power BI
We are going to create a Dashboard with the following visualizations:
1. Number of Unanswered Questions – These questions may have responses, but none of them are marked as “Answered”.
2. Number of Responseless Questions – These questions have no responses at all.
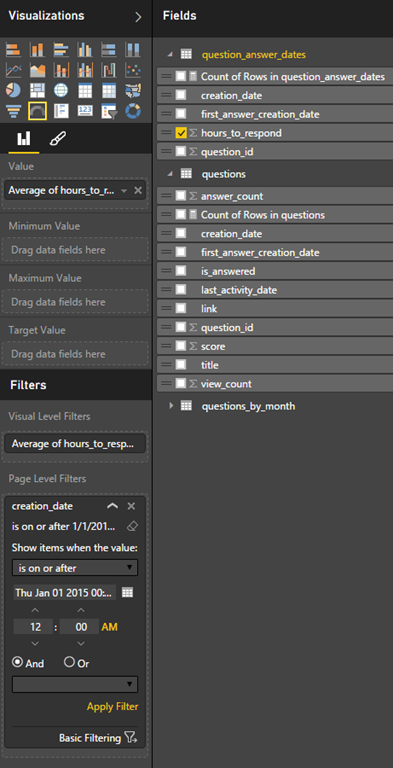
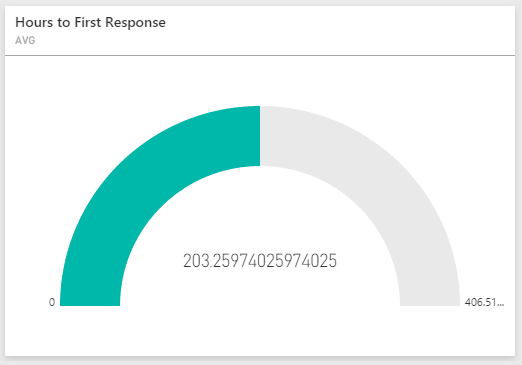
3. Time to First Response – The time difference between the creation of the question and the first response.
4. Number of Question Views Over Time – The number of views per month.
5. Number of Questions Created Over Time – The number of questions created per month.
In Power BI you have 3 things to be concerned about:
1. Datasets – The data that you are working with
2. Reports – The raw visualizations on top of your dataset
3. Dashboards – The organized reports that you will share with others.
Get Data
The first thing you need to do is setup a dataset in Power BI
1. Go to http://app.powerbi.com
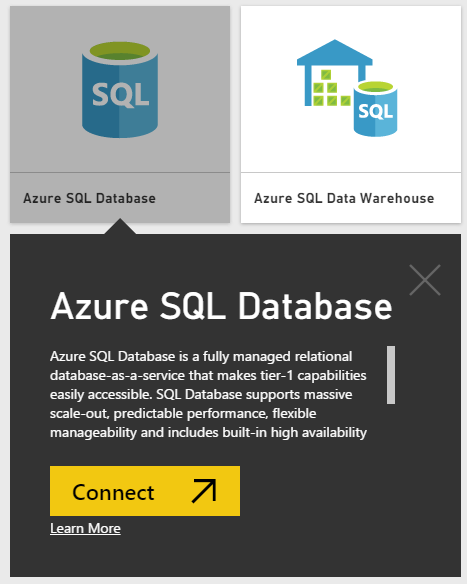
2. Click Get Data

3. Select Databases, then Select Azure SQL Database and Click Connect
4. Enter your Azure SQL database connection info:
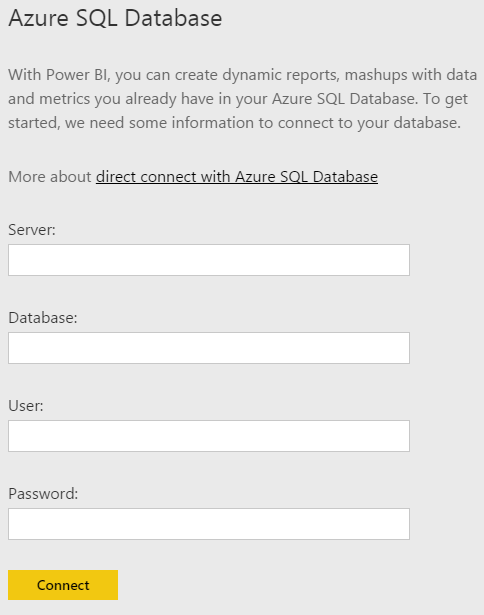
Power BI will connect to your database and import the data into a new dataset, which you can find in the left rail. 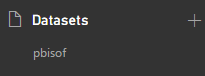
Create Reports
REPORT: Number of Unanswered Questions
Over in the left rail, click on the dataset, mine is called pbisof. Then, over in the right rail click on Fields, then questions.
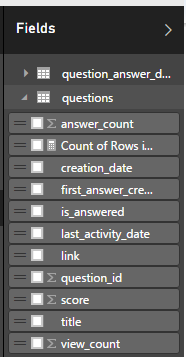
For this report we need to do 4 things:
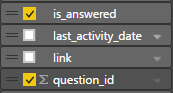
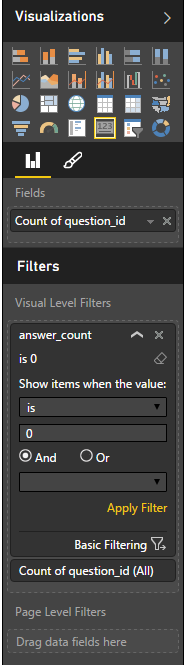
1. Select our fields. We want is_answered and question_id
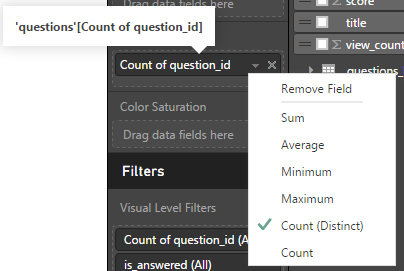
2. Set our field functions. We want the Count of question_id, not the sum
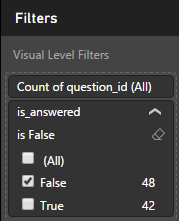
3. Filter by field value. We want to filter by is_answered = false
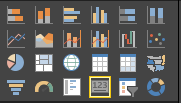
4. Select our visualization. For a count like this, the “card” visualization makes the most sense
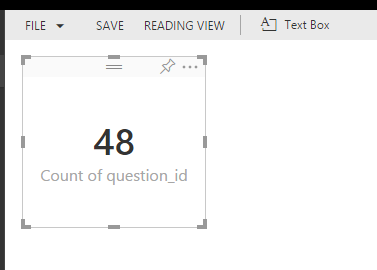
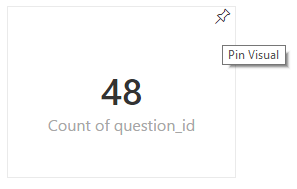
Here’s what you’ll now see in the report draft view.
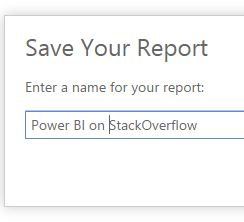
Click Save and name your report
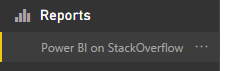
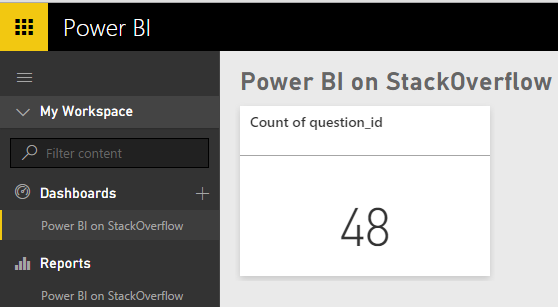
You will now see it in your Reports list
When you hover over the card you’ll see a pin, click that to add it to a Dashboard. (Make sure you create a Dashboard before clicking that pin)
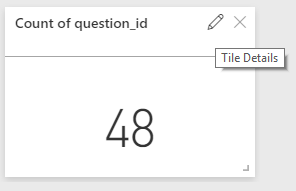
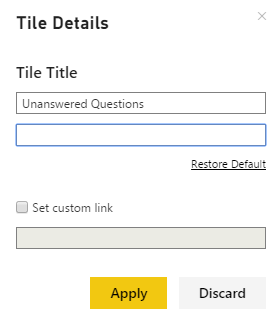
When you hover over the card you’ll see a pencil icon. Click that to edit the card title.
REPORT: Number of Responseless Questions
This visualization needs to show the number of questions that have no response at all.
REPORT: Time to First Response
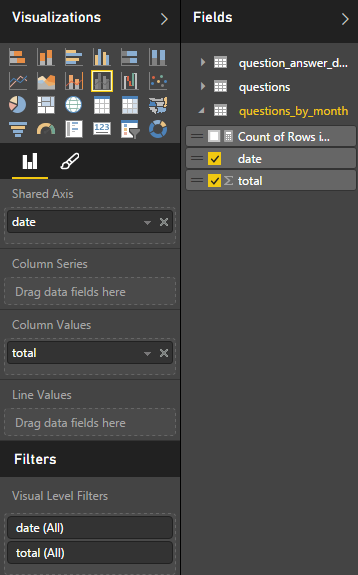
REPORT: Number of Questions Created Over Time
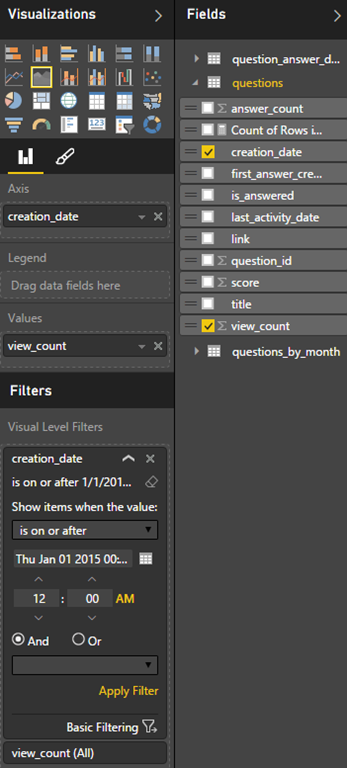
REPORT: Number of Question Views Over Time
Add all of those reports to your Dashboard and you’ll now have a Dashboard that looks something like this:
[
Here’s the same view in the Power BI iPhone app.
[
Jon