How to Embed and Filter a Power BI Report with the new Power BI Embedded JavaScript API
I was recently asked to help build a “Range Slider” Power BI Custom Visual that simply filters a report based on the slider value. Unfortunately “filtering” is not currently supported in the new Power BI Custom Visual SDK, but should be in the next couple of months.
Since this customer is already using Power BI Embedded, I suggested that they use the new Power BI Embedded JavaScript API to send filter commands from the hosting webpage to the embedded Power BI report.
It wasn’t as easy as it should be to get this implemented. There’s the new demo site, that helped with syntax, but it doesn’t allow you to change the filters. I hacked a version together that does allow you to edit the filter text, but uses JavaScript eval(), so the PR was denied, but the code still works. You can find my fork here: jongio / PowerBI-JavaScript.
You can find all of the working code from this walkthrough here: jongio / powerbi-embedded-javascript-api-range-slider-filter.
Create Report in Power BI Desktop
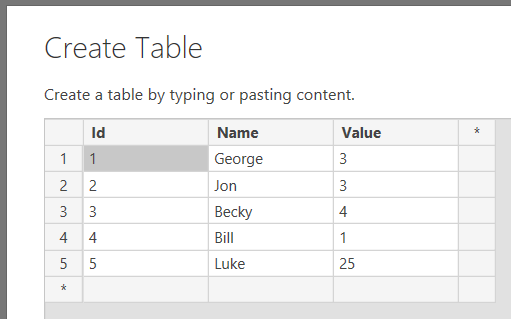
The first thing you are going to want to do is create a Power BI report using Power BI Desktop that you can later embed and filter. For this example, we are going to use a very simple table.
You can download this sample pbix from GitHub here: powerbi-embedded-sample.pbix
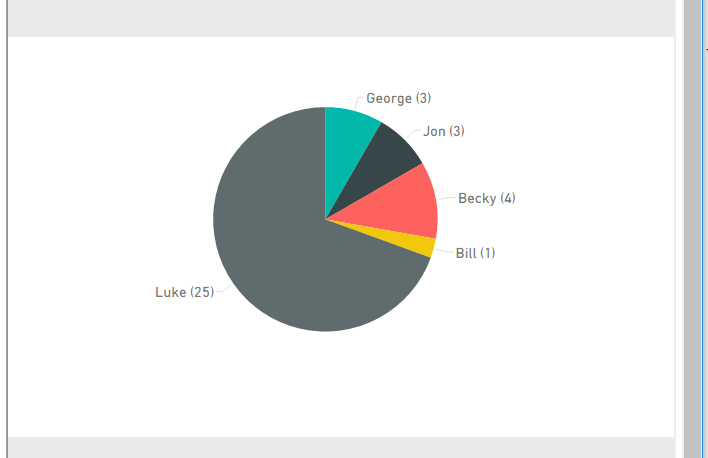
I added a simple pie chart

1. Open Power BI Desktop. Create a table and enter some data. 2. Save the .pbix file for later.
Create Power BI Embedded Assets in Azure
The topology of the Power BI Embedded implementation is as follows: Power BI Workspace Collections contain Power BI Workspaces which contain Reports. You create the Workspace Collection on Azure and then use the Node.js CLI to add Workspaces to the Collection and then add Reports to the Workspace. You’ll get the Access Key from the Azure Portal under the Workspace Collection.
Create Power BI Workspace Collection
You have 3 options to create a Power BI Workspace Collection:
1. Azure CLI 1.0
This allows you to create the Workspace Collection without having to use the Azure Portal. Following this tutorial to create the Workspace Collection, get your Access Key and then come back to this post.
2. Azure Portal
1. Go to the Azure Portal and create a new Power BI Workspace Collection.


2. Copy your Access Key to Notepad, you’ll need it later.

3. Azure CLI 2.0
This option allows you to create the Power BI Workspace Collection, but there is currently no way to get the Access Keys via the CLI 2.0. I do not recommend this approach at this time, but it will be the way going forward. I will update this post once that support is added.
Install the Power BI CLI
You just created the Workspace Collection, now we’ll create the Workspaces in that collection.
npm i -g powerbi-cli
```sql
### Create Power BI Workspace
```bash
powerbi create-workspace -c pbiejssample -k vq+0LR5JIod/7ztPI1iTWAqpc9dGVZWxsNSls8a2EORS43536VS0v275RBJMIMFB91/sHmxz7nJC+w2YOSixDA==
```python
- Replace -c value with your collection name- Replace -k with the Access Key for your Workspace Collection you created earlier. You can get that value from the Azure portal.
You’ll then see the workspace Id:
```bash
[powerbi] Workspace created: d66d8e42-b92a-4576-9072-fbaafb872ae7
```markdown
### Get Workspaces
You could also use the get-workspaces command to get the workspace Id.
```bash
powerbi get-workspaces -c pbiejssample -k vq+0LR5JIod/7ztPI1iTWAqpc9dGVZWxsNSls8a2EORS43536VS0v275RBJMIMFB91/sHmxz7nJC+w2YOSixDA==
```python
- Replace -c value with your collection name- Replace -k with the Access Key for your Workspace Collection you created earlier. You can get that value from the Azure portal.
You’ll then see the workspaces in the provided collection
```bash
[powerbi] ================================================[powerbi] Gettings workspaces for Collection: pbiejssample[powerbi] ================================================[powerbi] d66d8e42-b92a-4576-9072-fbaafb872ae7
```javascript
Copy that workspace Id to Notepad.
### Import Report Into Workspace
Use the import command to add the report you created earlier to the workspace you just created. You’ll need to pass in collection, accesskey, workspace id, name and the path to the pbix file.
```bash
powerbi import -c pbiejssample -k vq+0LR5JIod/7ztPI1iTWAqpc9dGVZWxsNSls8a2EORS43536VS0v275RBJMIMFB91/sHmxz7nJC+w2YOSixDA== -w d66d8e42-b92a-4576-9072-fbaafb872ae7 -n "Sample Data" -f powerbi-embedded-sample.pbix
```python
- Replace -c value with your collection name- Replace -k with the Access Key for your Workspace Collection you created earlier. You can get that value from the Azure portal.- Replace -w with the workspace Id
You’ll then see the success message
```bash
[powerbi] Importing powerbi-embedded-sample.pbix to workspace: d66d8e42-b92a-4576-9072-fbaafb872ae7[powerbi] File uploaded successfully[powerbi] Import ID: c0dfa1c9-cc24-4330-b215-5d5e57cb39c7[powerbi] Checking import state: Publishing[powerbi] Checking import state: Succeeded[powerbi] Import succeeded
```markdown
> Do not confuse Import ID above with the Report ID. They aren’t the same thing.
### Get Report ID
Now that you have the report added to the Workspace, you need to get the report Id.
```bash
powerbi get-reports -c pbiejssample -k vq+0LR5JIod/7ztPI1iTWAqpc9dGVZWxsNSls8a2EORS43536VS0v275RBJMIMFB91/sHmxz7nJC+w2YOSixDA== -w d66d8e42-b92a-4576-9072-fbaafb872ae7
```python
- Replace -c value with your collection name- Replace -k with the Access Key for your Workspace Collection you created earlier. You can get that value from the Azure portal.
You’ll see the reports with Ids outputted
```bash
[powerbi] =========================================[powerbi] Gettings reports for Collection: d66d8e42-b92a-4576-9072-fbaafb872ae7[powerbi] =========================================[powerbi] ID: 4964a947-857f-4c14-914d-c66e1c5713cd | Name: Sample Data
```markdown
Save that report Id to Notepad.
### Get Embed Token
You will need this token to embed a report into an HTML page. In production scenarios you will generate this in real-time after you have authenticated your user.
```bash
powerbi create-embed-token -c pbiejssample -k vq+0LR5JIod/7ztPI1iTWAqpc9dGVZWxsNSls8a2EORS43536VS0v275RBJMIMFB91/sHmxz7nJC+w2YOSixDA== -w d66d8e42-b92a-4576-9072-fbaafb872ae7 -r 4964a947-857f-4c14-914d-c66e1c5713cd
```python
- Replace -c value with your collection name- Replace -k with the Access Key for your Workspace Collection you created earlier. You can get that value from the Azure portal.- Replace -w with the workspace Id- Replace -r with the report Id
That will output the embed token. Copy it to Notepad.
```bash
[powerbi] Embed Token: eyJ0eXAiOiJKV1QiLCJhbGciOiJIUzI1NiJ9.eyJ2ZXIiOiIwLjIuMCIsImF1ZCI6Imh0dHBzOi8vYW5hbHlzaXMud2luZG93cy5uZXQvcG93ZXJiaS9hcGkiLCJpc3MiOiJQb3dlciBCSSBOb2RlIFNESyIsIndjbiI6InBiaWVqc3NhbXBsZSIsIndpZCI6ImQ2NmQ4ZTQyLWI5MmEtNDU3Ni05MDcyLWZiYWFmYjg3MmFlNyIsInJpZCI6IjQ5NjRhOTQ3LTg1N2YtNGMxNC05MTRkLWM2NmUxYzU3MTNjZCIsIm5iZiI6MTQ4MzQ4NTYzNywiZXhwIjoxNDgzNDg5MjM3fQ._2ziDo37r_9LqSBvur-azWjOlVmXAznd6NROWdjejfY
```csharp
> If at any point you get a permission denied or content doesn’t exist error, just rerun the create-embed-token command and use the new one that is created. I think it expires in 20 minutes by default.
You now have everything from Power BI that you that need to embed your report.
## Create Webpage to Host Power BI Report
### Install the Power BI Client Side JavaScript API
Find a good directory on your computer to create the website and install the powerbi-client npm package.
```bash
npm i powerbi-client --save
```sql
### Create a Webpage that contains the following code
- Replace embedToken value with the embed token you created earlier.- Replace reportId value with the report Id you created earlier.
```html
<html>
<body> <div id="reportContainer"></div>
<script src="./node_modules/powerbi-client/dist/powerbi.min.js"></script>
<script> (function () { var embedToken = 'eyJ0eXAiOiJKV1QiLCJhbGciOiJIUzI1NiJ9.eyJ2ZXIiOiIwLjIuMCIsImF1ZCI6Imh0dHBzOi8vYW5hbHlzaXMud2luZG93cy5uZXQvcG93ZXJiaS9hcGkiLCJpc3MiOiJQb3dlciBCSSBOb2RlIFNESyIsIndjbiI6InBiaWVqc3NhbXBsZSIsIndpZCI6ImQ2NmQ4ZTQyLWI5MmEtNDU3Ni05MDcyLWZiYWFmYjg3MmFlNyIsInJpZCI6IjQ5NjRhOTQ3LTg1N2YtNGMxNC05MTRkLWM2NmUxYzU3MTNjZCIsIm5iZiI6MTQ4MzQ4NTYzNywiZXhwIjoxNDgzNDg5MjM3fQ._2ziDo37r_9LqSBvur-azWjOlVmXAznd6NROWdjejfY'; var reportId = '4964a947-857f-4c14-914d-c66e1c5713cd'; var embedUrl = 'https://embedded.powerbi.com/appTokenReportEmbed?reportId=' + reportId;
var config = { type: 'report', accessToken: embedToken, embedUrl: embedUrl, id: reportId, settings: { filterPaneEnabled: false, navContentPaneEnabled: false } };
powerbi.embed(document.getElementById('reportContainer'), config);
})();
</script>
</body>
</html>
```python
> The above code won’t work in IE. Please see full example below for a version that works in IE.
- You declared a div: reportContainer- You referenced the powerbi.min.js file.- You setup some variables to hold the token and reportId you created earlier- You called powerbi.embed to bind the report to the div.
You should now see your report embedded into the webpage. You can use http-server to serve the current folder from localhost.
```bash
npm i -g http-server
```markdown
## Filter Report with Range Slider
We are now going to filter the report with a [jQuery UI Slider control](https://jqueryui.com/slider/).
1\. Install the jquery and jquery-ui npm packages
```bash
npm i jquery --savenpm i jqueryui --savenpm i es6-promise --save
```text
2\. Reference the jquery and jquery-ui js and the css.
```html
// before end of <body><script src="./node_modules/jquery/dist/jquery.min.js"></script><script src="./node_modules/jqueryui/jquery-ui.min.js"></script><script src="./node_modules/es6-promise/dist/es6-promise.auto.min.js"></script>
// in <head><link rel="stylesheet" href="./node_modules/jqueryui/jquery-ui.min.css">
```csharp
3\. Add a new div to your html page
```html
<div id="slider" />
```csharp
4\. Add a new filter method to be called when your filter changes.
You can learn all about the JavaScript API [here](https://github.com/Microsoft/PowerBI-JavaScript).
> The important thing to observe here is the table and column values. Those are set to match the table and column names you created in Power BI Desktop earlier.
The code will construct a filter based on the value passed to it and call the setFilters method on the report.
```javascript
function filter(values) { const filter = { $schema: "https://powerbi.com/product/schema#basic", target: { table: "Data", column: "Value" }, operator: "In", values: values };
var report = powerbi.embeds[0]; if (report) { report.setFilters([filter]) .then(function (result) { console.log(result); }) .catch(function (errors) { console.log(errors); }); }}
```text
6\. Instantiate the slider
```javascript
$(e => { $("#slider").slider({ min: 3, max: 5, step: 1, slide: function (event, ui) { filter([ui.value]); } });});
```text
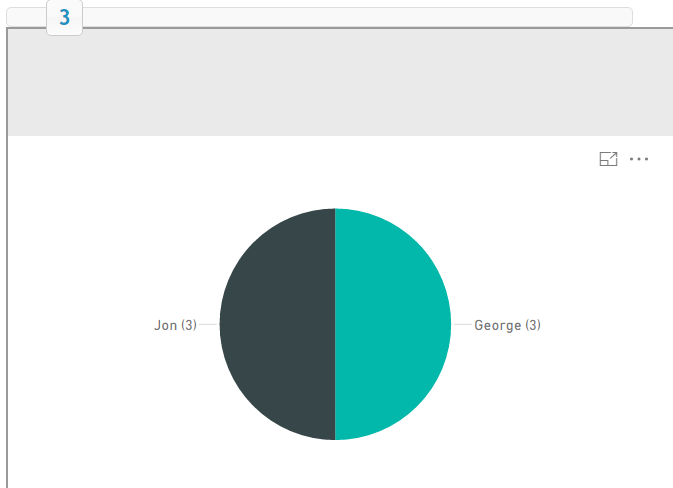
7\. When you now run the webpage you will see a slider control at the top and when you select “3” it will filter the pie chart to only those value that are equal to “3”
Here’s a full working sample that you should be able to just copy and paste into your application after install the npm packages.
```html
<!doctype html>
<html>
<head> <title>Power BI Embedded with Filtering Sample</title> <link rel="stylesheet" href="./node_modules/jqueryui/jquery-ui.min.css"> <style> #slider { width: 500px; } #reportContainer { height: 500px; } #custom-handle { width: 1.6em; height: 1.6em; top: 50%; margin-top: -.8em; text-align: center; line-height: 1.6em; } </style>
</head>
<body>
<div id="slider"> <div id="custom-handle" class="ui-slider-handle"></div> </div>
<div id="reportContainer"></div>
<script src="./node_modules/jquery/dist/jquery.min.js"></script> <script src="./node_modules/jqueryui/jquery-ui.min.js"></script> <script src="./node_modules/es6-promise/dist/es6-promise.auto.min.js"></script> <script src="./node_modules/powerbi-client/dist/powerbi.min.js"></script>
<script>
$(function () { var handle = $("#custom-handle"); $("#slider").slider({ min: 1, max: 25, step: 1, create: function () { handle.text($(this).slider("value")); }, slide: function (event, ui) { handle.text(ui.value); filter([ui.value]); } });
(function () { var embedToken = 'eyJ0eXAiOiJKV1QiLCJhbGciOiJIUzI1NiJ9.eyJ2ZXIiOiIwLjIuMCIsImF1ZCI6Imh0dHBzOi8vYW5hbHlzaXMud2luZG93cy5uZXQvcG93ZXJiaS9hcGkiLCJpc3MiOiJQb3dlciBCSSBOb2RlIFNESyIsIndjbiI6InBiaWVqc3NhbXBsZSIsIndpZCI6ImQ2NmQ4ZTQyLWI5MmEtNDU3Ni05MDcyLWZiYWFmYjg3MmFlNyIsInJpZCI6IjQ5NjRhOTQ3LTg1N2YtNGMxNC05MTRkLWM2NmUxYzU3MTNjZCIsIm5iZiI6MTQ4MzY2MTY4OSwiZXhwIjoxNDgzNjY1Mjg5fQ.-g6Zh5AthZDCfZLEtvnl7mXDMBYjwauZyBORer--xb0'; var reportId = '4964a947-857f-4c14-914d-c66e1c5713cd'; var embedUrl = 'https://embedded.powerbi.com/appTokenReportEmbed?reportId=' + reportId;
var config = { type: 'report', accessToken: embedToken, embedUrl: embedUrl, id: reportId, settings: { filterPaneEnabled: false, navContentPaneEnabled: false } };
powerbi.embed($('#reportContainer')[0], config);
})(); });
function filter(values) { const filter = { $schema: "https://powerbi.com/product/schema#basic", target: { table: "Data", column: "Value" }, operator: "In", values: values };
var report = powerbi.embeds[0]; if (report) { report.setFilters([filter]) .then(function (result) { console.log(result); }) .catch(function (errors) { console.log(errors); }); } }
</script></body>
</html>Share on LinkedIn
Quick Share: Your custom post text has been copied to your clipboard! Click the button below to open LinkedIn's share dialog, then paste it.
💡 Tip: LinkedIn will open in a new tab. Use Ctrl+V (or Cmd+V on Mac) to paste your text.
Note: LinkedIn will show the article preview. You can add your custom text above it.