UPDATE: The Liquid Fill Gauge visual is now available to download from the Power BI Custom Visual Gallery!
–
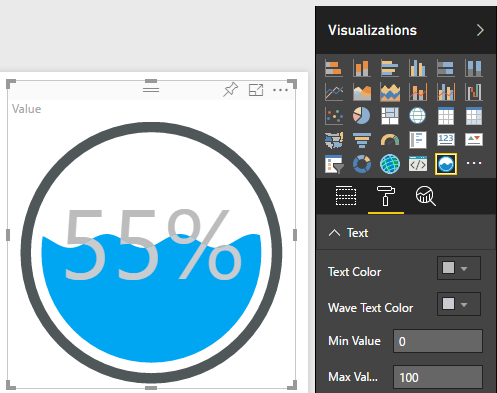
In this series, we are creating a Power BI Custom Visual from an OSS d3 visualization I found on GitHub called Liquid Fill Gauge built by Curtis Bratton. It renders a circular gauge with an internal animated wave that represents a “percent full” value.

Download the Liquid Fill Gauge Custom Visual
View Liquid Fill Gauge Source Code----------------------------------
Here are the previous posts:
1. How to Create a Power BI Custom Visual Based on an Existing d3 Visual - Part 1 - Dev Env Setup, Reference and Testing
2. How to Create a Power BI Custom Visual Based on an Existing d3 Visual - Part 2 - Capabilities, dataRoles and dataViewMappings
This post is about setting up custom format properties to allow the Power BI user to change the way your visual is formatted (i.e. colors, fonts, widths, etc).
Here’s an example of what a custom format properties looks like:
Steps to enable Custom Visual custom properties
1. Define the property metadata in capabilities.json
2. Handle the setting of property values in enumerateObjectInstances method
3. Get property values with objectEnumerationUtility.js
4. Use a “settings” object as an in-memory property store that you use in your visual.
1. Define the property metadata in capabilities.json
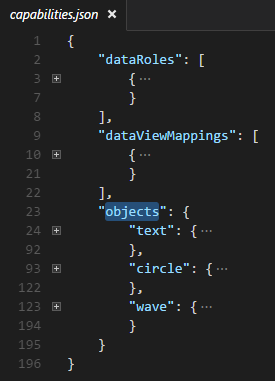
The first thing you need to do is define your properties in your capabilities.json file. They are included in the “objects” object at the same level as dataRoles and dataViewMappings.
See this file for the complete example.
The first child of the objects properties is the “property group”. In this example we have “text”, “circle” and “wave” groups.
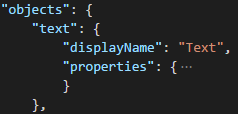
Each “property group” has a displayName property (that’s what will appear in the Power BI format pane) and a “properties” object.
Each property has a displayName, description and type. (There are other properties as well, but we won’t get into that here). In the example below, you can see that a “color” is fill->solid->color:true. I’ve also included a numeric and bool sample
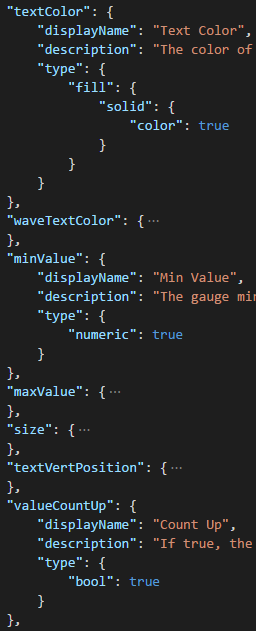
ISSUE: Do not use “textSize” as a property key as is appears to be a reserved key by Power BI and it will always render the “text size” slider that defaults to a min value of 8. See this issue for updates on that.
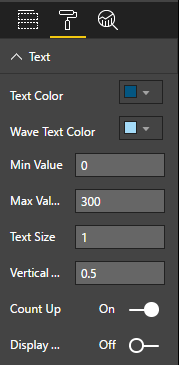
Here’s how that renders:
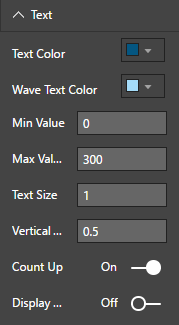
The UI elements are dataType driven, so you automatically get the color selector when you set the type to fill->solid->color…same goes for bool, with the on/off switch.
2. Handle the setting of property values in enumerateObjectInstances method
Power BI uses the enumerateObjectInstances method to map and store properties to an internal “metadata.objects” property. The enumerateObjectInstances method is called for every “property group” that you define in capabilities.json. You can see below that I have a case statement that matches the “key” from my “objects” in my capabilities.json file called “text”.
This is where Power BI stores the values, so you want to assign each property to whatever value you have stored. I used a “settings” object to store these values.
My visual needed the color in hex form, but when I save it to the Power BI metadata, it needs to be a “Fill” object, which is why I wrap it in {solid:{color: [value]}}.
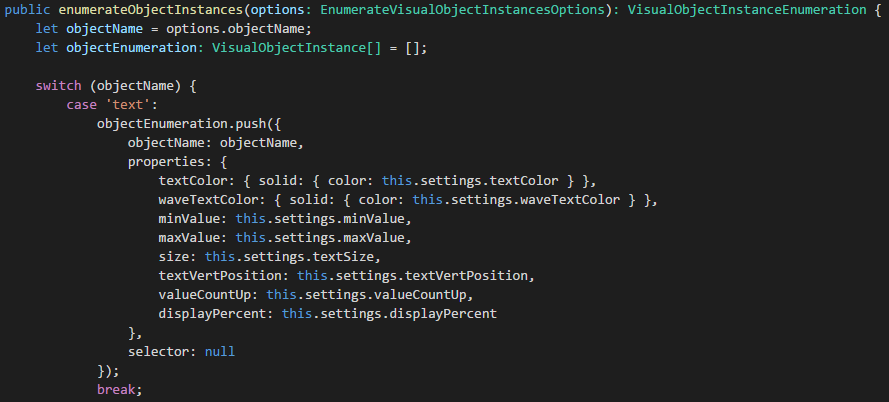
See visual.ts for complete example of this method.
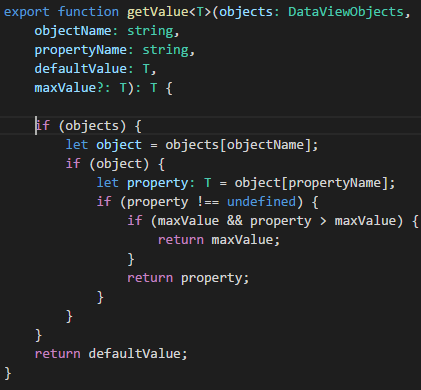
3. Get property values with objectEnumerationUtility.js
Now that you have the values stored in metadata, you’ll want to get the values out and use them in your visual. Power BI provides a sample .js file for doing so. I took their version and added a maxValue optional parameter:
Add this file to your /src folder and update your tsconfig.json
4. Use a “settings” object as an in-memory property store that you use in your visual.
Power BI recommends using TypeScript definitions and the visualTransform method for doing what I do here, but I didn’t want to take on anymore overhead than necessary and I wanted to try to do the least amount of code to do the conversion from an existing visual to a Power BI one.
So, I just reused the settings object that was included with the original liquidFillGauge and am using the “getValue” method from objectEnumerationUtility.js.
ISSUE: Power BI does not correctly update the options.type property when a “Style” object is changed. I’ll be able to remove some of the compare code when they fix this bug.
I created a “getSettings” method that populates the settings object. You just pass in the metadata.object property, propertyGroup key, property key, default value and in some cases a maxValue. Take notice of how I deal with “color” based properties. I use the “Fill” type, wrap the default value in a json object and then call solid.color to get the value into the settings object. You won’t need to do it this way if you are creating from scratch and use the recommended ViewModel approach. I wanted to use the settings object as is and it uses hex, so that’s why I have to do that conversion.
I went through and added properties to change just about every aspect of the liquid fill gauge….including being able to set difference colors for the wave, text and circle.
Jon